

Most monthly marketing reports fail in one of 2 ways. Either the CEO gets a 40 metric dashboard export and reads none of it, or they get 3 numbers with no context and start asking about the other 37. Both versions cost the marketing leader the same thing, which is trust.
The fix is not a better dashboard. It is a 1 page readout with the same 5 numbers every month, each shown against plan, with a 3 month trend and 1 sentence of explanation. In most companies this rhythm already has a name, the MBR, the monthly business review, and this page is the marketing section of it. This post covers the 5 numbers that belong on the page, the 15 that should come off it, and the format that makes leadership stop asking for more.
Key takeaways
- A monthly marketing report works when it shows the same 5 numbers every month, against plan, with trends. Consistency builds trust. Coverage does not.
- The 5: revenue vs the committed plan, contribution margin dollars, blended CAC with its direction, new customers vs goal, and repeat revenue share.
- The 15 that come off the page are not bad metrics. They are operating metrics, and they belong in the weekly channel review instead.
- Marketing budgets are flat at 7.7% of company revenue and 59% of CMOs say they cannot fully fund their strategy. Budget conversations go better when leadership already trusts your numbers.
- Each number gets 1 sentence that explains why it moved, and the page ends with 1 flag line: the decision you need or the risk you are watching.
More metrics make leadership trust you less
Sending more numbers feels safer, and it does the opposite. A CEO reading a 40 metric export cannot tell which numbers matter, so the filtering job lands on the person with the least context to do it. Every metric on the page is also a question you will eventually be asked, which means a crowded page guarantees you will spend next month's meeting explaining a CTR change that affects nothing.
The dynamic compounds in meetings. A crowded page turns the monthly review into a tour, and a tour always finds something that looks alarming out of context. A 5 number page turns the same meeting into 3 questions about things that matter, and it usually ends early. Leadership remembers which meetings end early.
The stakes behind this are not small. Gartner's 2025 CMO survey put marketing budgets at 7.7% of company revenue for the 2nd year running, with 59% of CMOs reporting they cannot fully fund their strategy. Flat budgets mean every dollar gets argued for, and the marketing leader whose numbers leadership trusts starts that argument ahead. Spencer Stuart's tenure research makes the same point from the other side: CMOs at consumer companies average 3.5 years in the seat, the shortest tenure in the C-suite. How you report is part of how long you get to keep reporting.
The 5 numbers
| Number | The question it answers | How to show it |
|---|---|---|
| Revenue vs committed plan | Are we on the plan we agreed to? | Actual against the committed number from the last reforecast, gap in dollars and %, 3 month trend |
| Contribution margin dollars | Is the revenue worth having? | Dollars after product costs, fulfillment, and marketing spend. Use a definition finance signs off on |
| Blended CAC, with direction | What does a customer cost us now? | 1 blended number and its 3 month direction. No channel split on this page |
| New customers vs goal | Is the acquisition engine working? | Count against goal, at the CAC above |
| Repeat revenue share | How much of the business is already ours? | % of revenue from existing customers, the floor under any forecast |
Each row gets 4 things: plan, actual, 3 month trend, and 1 sentence. The sentence is where the work shows. It explains why the number moved, not what it did, because leadership can read the direction themselves. "CAC up 9.7%, driven by the Meta creative gap, new batch live June 20" answers the follow-up before it gets asked. Write the sentence for a reader with no marketing context, and if it needs a 2nd sentence, the explanation belongs in the appendix.
These 5 work because they connect to each other. Revenue says whether the plan held. Margin says whether the revenue was worth having. CAC says what growth costs now. New customers say whether the engine ran. Repeat share says how much of next quarter is already secured. A CEO can hold 5 connected numbers in their head. Nobody holds 40.
Two practical notes on building the rows. The plan column comes from whatever number leadership last agreed to, which after a mid-year reforecast means the committed number, not the original December plan and not the stretch. And every definition on the page needs sign off from finance once, in writing, before the first readout goes out. The expensive version of skipping this is a CFO recalculating contribution margin differently in the same meeting, at which point the conversation is about arithmetic instead of the business.
The 15 that come off the page
| Group | Metrics | Where they belong |
|---|---|---|
| Too noisy month to month | Daily revenue, AOV swings, site sessions, conversion rate | The weekly ops review, where noise gets averaged out before anyone reacts to it |
| Wrong altitude | Campaign ROAS, channel ROAS, CPM, CPC, email open rate | Channel team scorecards. These are steering inputs, not outcomes |
| Vanity | Impressions, follower count, engagement rate | A quarterly brand review, if anywhere |
| Contested definitions | Platform attributed revenue totals, modeled LTV projections, attribution model comparisons | The analyst workbench, until the methodology is agreed and stable |
None of these are bad metrics. They are operating metrics, and the difference matters. Operating metrics exist so the team can steer week to week. Outcome metrics exist so leadership can judge the plan month to month. When operating metrics reach the CEO, 2 bad things happen at once: the page gets too crowded to read, and leadership starts steering the channels instead of judging the plan.
Cutting them is not hiding them. Keep a standing appendix that anyone can open, and say so on the page. The readout is the contract about what gets discussed; the appendix is proof there is nothing behind the curtain.
If you are switching from a bigger report, say so instead of just shrinking the page. Tell leadership the monthly report is moving to 5 numbers plus an appendix, send both versions side by side for 1 month, then retire the old one. The announcement matters because a report that shrinks without explanation reads as hiding something, and the point of the change is the opposite. Expect a few weeks of questions about where a metric went, answer them from the appendix, and hold the page at 5.
The format, and how to defend it
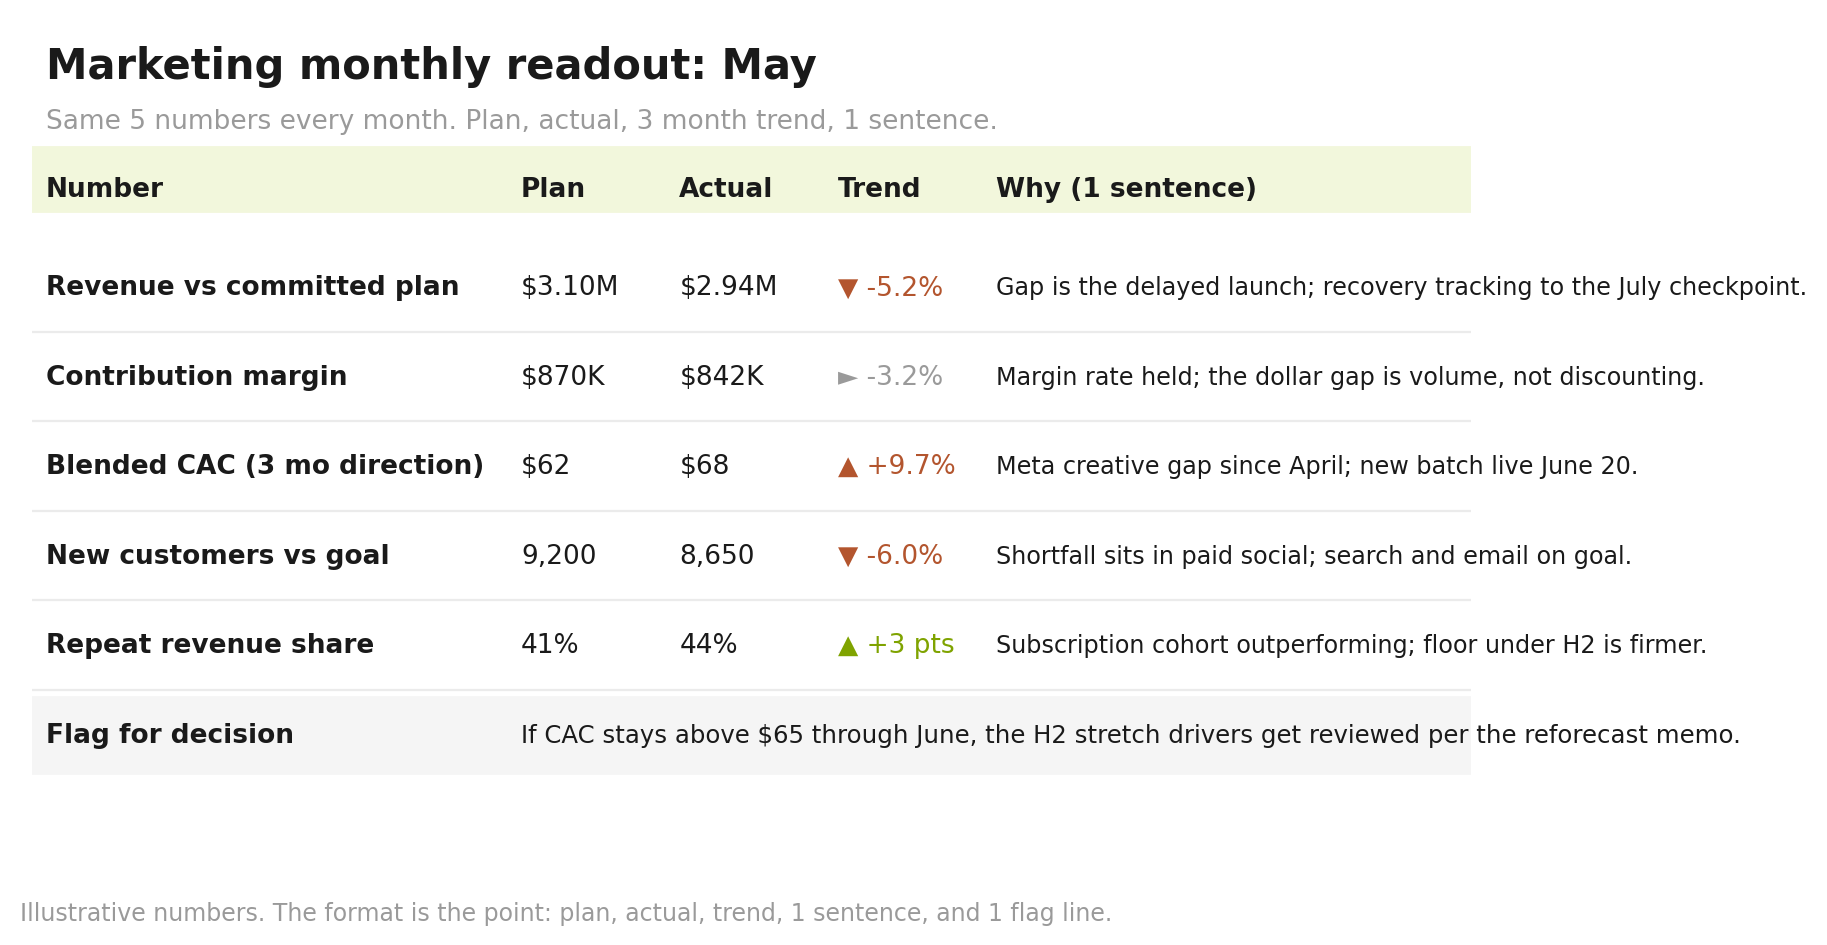
The whole report. 5 rows, 4 columns, 1 flag line. Illustrative numbers.
If your company runs a formal MBR, this page is marketing's section of it: same 5 rows, same order, every month, readable in 90 seconds before the discussion starts. The page ends with 1 flag line: the decision you need from leadership or the risk you are watching. Some months the flag line is "nothing needs a decision," and writing that builds as much trust as the numbers do.
The format gets tested the first time the CEO asks for a 6th number. Answer the question, in the sentence line or the appendix, and keep the page at 5. Numbers added during a nervous month never come off, and a page that grows under pressure stops being a contract. The same discipline applies in reverse: do not swap definitions mid-year. If contribution margin changes definition in September, the 8 months of trend before it become noise, and the trend is most of the page's value.
This page also has a job in your planning rhythm. If you run a mid-year reforecast with a committed and a stretch number, the readout is its monthly heartbeat: the committed number is the plan column, and the flag line is where the pre-agreed triggers get called. One more boundary worth keeping: the readout is not the channel for surprises. Bad news travels the day you find it. The readout records it, with the why sentence attached.
Timing is part of the format too. The page lands on the same business day every month, ideally the 8th day of the month, whether the month was good or bad. One week buffer should be given for numbers to finalize after month's end. The direction and insights can already be written, with final numbers pulled last minute and inserted before delivery.
Producing the page is the actual hard part. The 5 numbers live in 5 systems that disagree, and assembling them barely a week into the month is a project when it should be an export. Shopify, the ad platforms, the email tool, and finance each keep their own version of last month, and reconciling them by hand is how the 8th slips to the 15th. That is the work we do at Hologrow: one transparent view of your marketing and commerce data, every number traced back to its source. Contact us for a demo and the monthly readout stops being a monthly project.
FAQs
What marketing metrics should a CEO see monthly?
5 outcome metrics: revenue against the committed plan, contribution margin dollars, blended CAC with its 3 month direction, new customers against goal, and repeat revenue share. Each shown with plan, actual, trend, and 1 sentence on why it moved.
How many KPIs should a marketing report have?
For a CEO or leadership audience, 5, shown consistently every month. Channel teams need more, and that is the point: operating metrics belong in weekly team reviews, outcome metrics belong in front of leadership.
Should I show ROAS to my CEO?
Channel and campaign ROAS are steering metrics, so no. Blended CAC and contribution margin carry the same information at the right altitude. If leadership asks for ROAS specifically, put platform-attributed numbers in an appendix with their caveats attached, because platform ROAS figures disagree with each other by design.
How do I present marketing results to the board?
Quarterly, use the same 5 numbers with identical definitions, then add a cohort view and progress against the annual plan. The worst version is a board deck whose numbers do not match the monthly readout, because the mismatch becomes the meeting.
What is a good monthly marketing report format?
1 page. 5 rows, 1 per number, with plan, actual, 3 month trend, and a 1 sentence explanation each, plus a single flag line at the bottom for the decision you need or the risk you are watching. Same format every month. If your company runs an MBR, this page is the marketing section of it, unchanged.
Why is consistency more important than detail in executive reporting?
Trend value compounds: month 8 of the same 5 numbers tells leadership more than any 40 metric snapshot. Changing the metrics or definitions mid-year resets that value to zero, and it reads as managing the narrative even when it is not.


